Along with the interactive results, Snowsight also offers a Chart Visualization service.
The section dedicated to this type of charting is located in the window that opens after running a query.
To switch from the results screen to the chart screen you can use the shortcuts seen here.
To show how this part of the interface works I generated a dummy table in Mockaroo with columns containing different types of variables (in this case only categorical and integer data).
After doing a SELECT * from the created table we observe what is the graphical output that Snowsight offers.
There are various types of representation that I am going to describe.
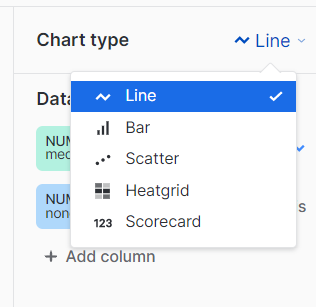
Line Chart
The Line Chart is the first graphical output displayed.
Should be defined an X-Axis must be defined, can be defined also its bucketing criterion and then should be selected the series that are plotted on the Y-Axis.
For each one you can decide the type of data aggregation among the main statistical descriptors (count, min, max, cum. median, average, mode) and this will also be valid for the types of graphs I will discuss later (except the scoreboard ).
Different series can be superimposed for immediate visual comparison.
If you hover the cursor over the graph you can see the relative values for all the series that are included in the graph.
In the video I show the process required for defining the X-axis, entering the data sets, and choosing bucketing and aggregation (for the other chart types the process is similar).
Bar diagram
The bar chart is the tool that offers the highest degree of customization.
In the following video you can observe that you can personalize:
- Orientation of the bars
- Type of grouping
- Whether to have a display of the true values resulting from the query or to have a percentage representation (if the data are grouped you can decide)
- Method of sorting : ascending or descending
- Distribution along the x-axis : you can keep the order imposed by the column you have chosen as the X-axis or you can sort by the height of the bar.
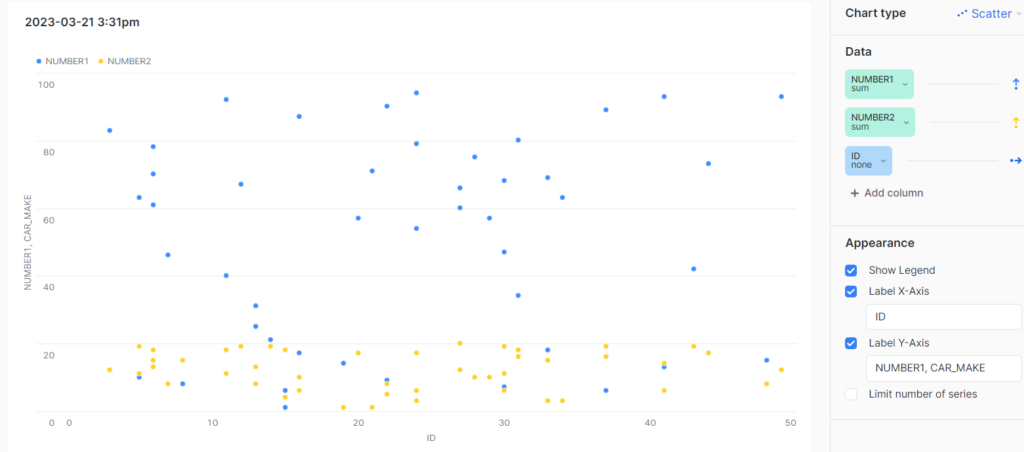
Scatter plot
Scatter plot is a way of visualizing data in a pointwise manner. I find it useful to see the concentration of values in a certain area, to study the density of data in a certain range of values. This type of representation does not have many customizable options. Multiple series can be overlaid, and you can choose the X-axis bucketing strategy and the aggregation strategy for series on the Y-axis .
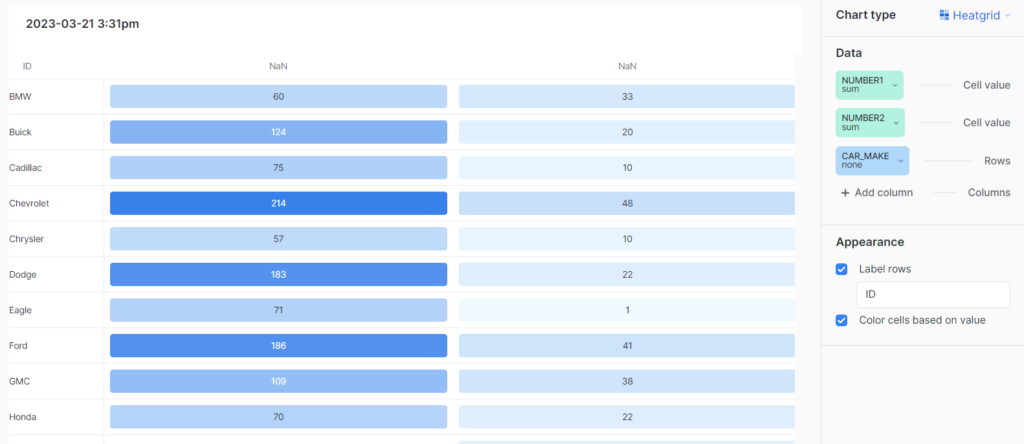
Heatgrid
The Heatgrid allows us to have a map with different color intensities depending on the values, in this case a higher value corresponds to a more pronounced shade of blue.
To use this representation we need to specify the two axes identified as Row and Columnand then the column whose value we want to see, for those with a lot of imagination this could be considered a 3-dimensional graph (the third dimension is color intensity).
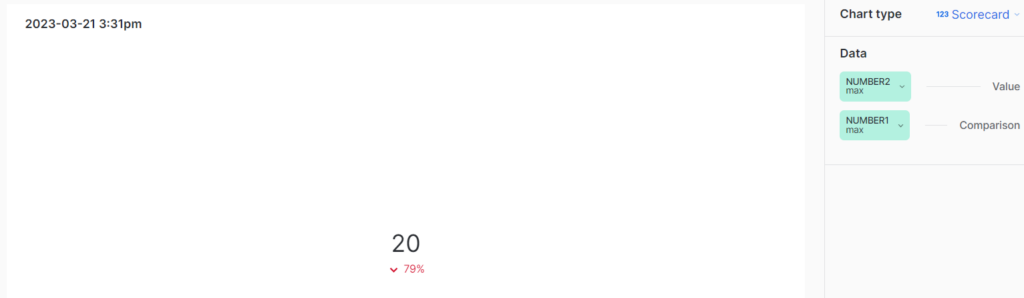
Scorecard
The Scorecard is not a graphical representation but is a feature that allows you to have an immediate percentage comparison between two quantities. Therefore, in this case there are no bucketing options, one only has to specify a descriptor of one series that will be the comparison term and then the descriptor of another series (or even of the same) that will be compared. The output is a percentage value with arrows indicating an upward or downward trend.
Conclusion
The Chart Visualizations tool is definitely a great way to get a quick impression of trends, in my opinion even better than the interactive results, my advice is to use them by choosing carefully:
- X-axis bucketing
- The type of data aggregation (if making comparisons the magnitudes being compared must be consistent, perhaps it does not make much sense to compare the count of one series with the minimum of another)
- Always take into account the arguments required by each type of representation visible in the column to the right (row, column, values, numerosity)