As we know on Snowflake our warehouses can execute one operation per time per user. So if you want to see some additional information then existing once in table, you can either make some joins with the tables that you want to work. But if you don’t have any relations in between the tables so if you can’t do any joins but still want to see the results together you can use Snowflake Dashboards. It allows us to see multiple results in the same screen. In Snowflake Dashboard every cel that you create will be different worksheets. You can create new worksheets or either use the existing ones. You can display your results and the chart visualization of them in differet cells (for more details on query charts you can check this blog).
Let’s go ahead with some examples using Snowflake Sample Data. In this blog I will use TPCH_SF10 Schema of this database to execute our queries and display our results and charts in Dashboard (you can check the ERD diagram of our dataset from this link).
Dashboards Examples on Snowflake
Let’s start with creating a Dashboard on our Snowflake instance:
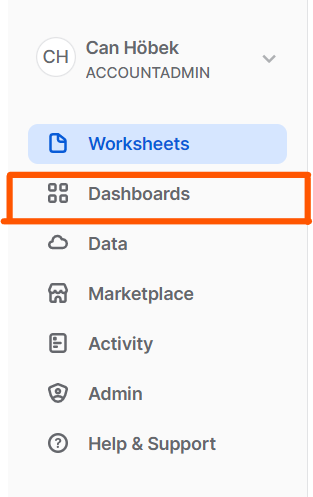
1) In Snowsight click to Dashboard
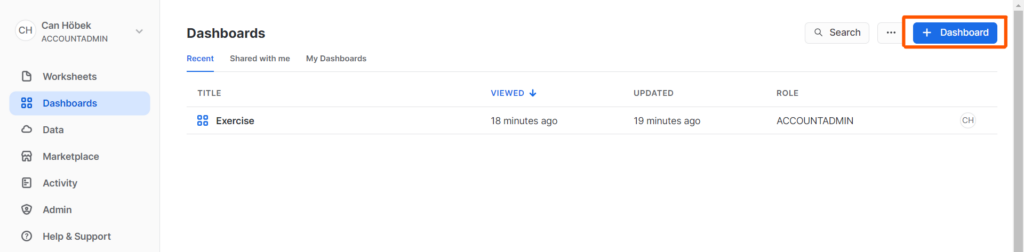
2) Click to a ‘+ Dashboard’ button at the top right corner (it will ask you to enter a Dashboard name
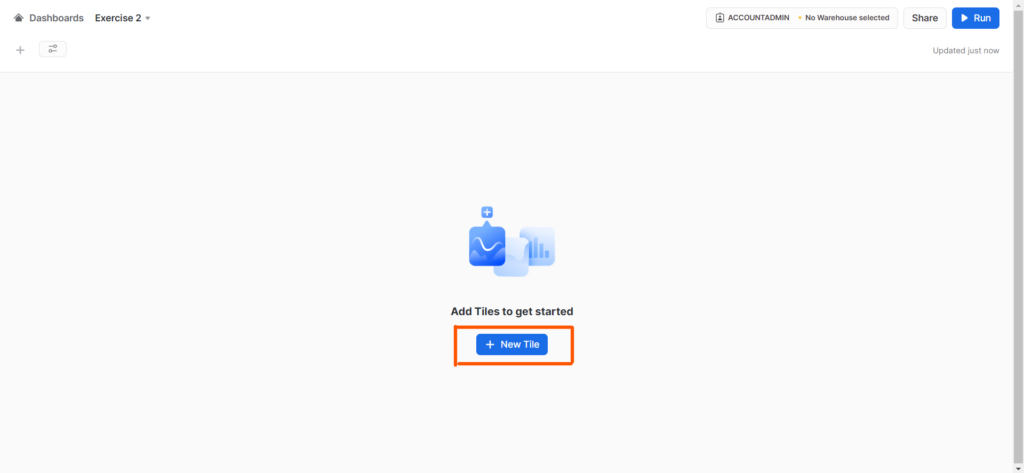
3) Once you entered to Dashboard there will be a ‘+ New Tile’ button in the center and by pressing on it you can add a new worksheet to your Dashboard
4) Once you created your worksheet, you can run this code to grab number of customers in each nation
USE DATABASE snowflake_sample_data;
USE SCHEMA tpch_sf10;


SELECT nation.n_name
    , COUNT(DISTINCT customer.c_custkey)
FROM customer
INNER JOIN nation
ON nation.n_nationkey = c_nationkey
GROUP BY nation.n_nationkey, nation.n_name
ORDER BY nation.n_name
LIMIT 1000;           --to limit our returned data
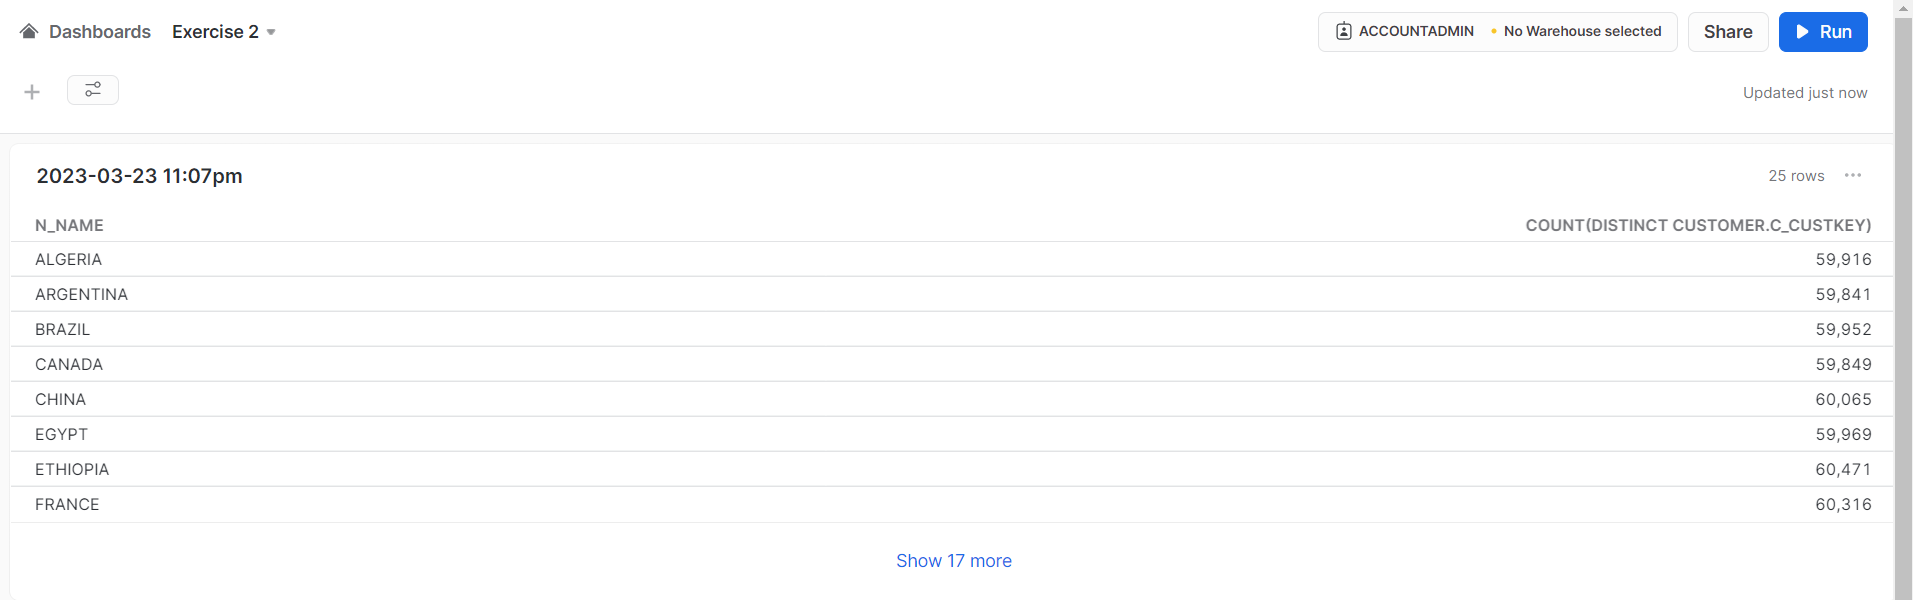
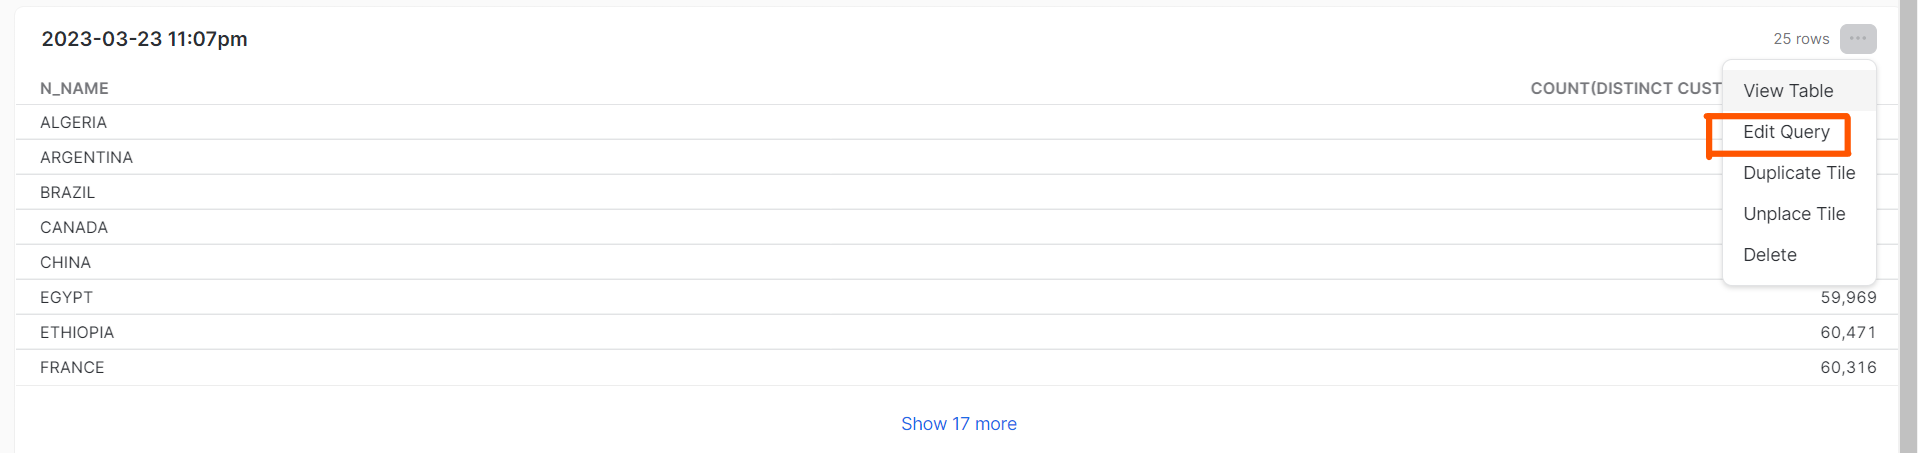
you will get this type of result when you runned the code,
5) afterwards you can go to 3 dots on the worksheet and press ‘EDIT QUERY’ and then press to chart:
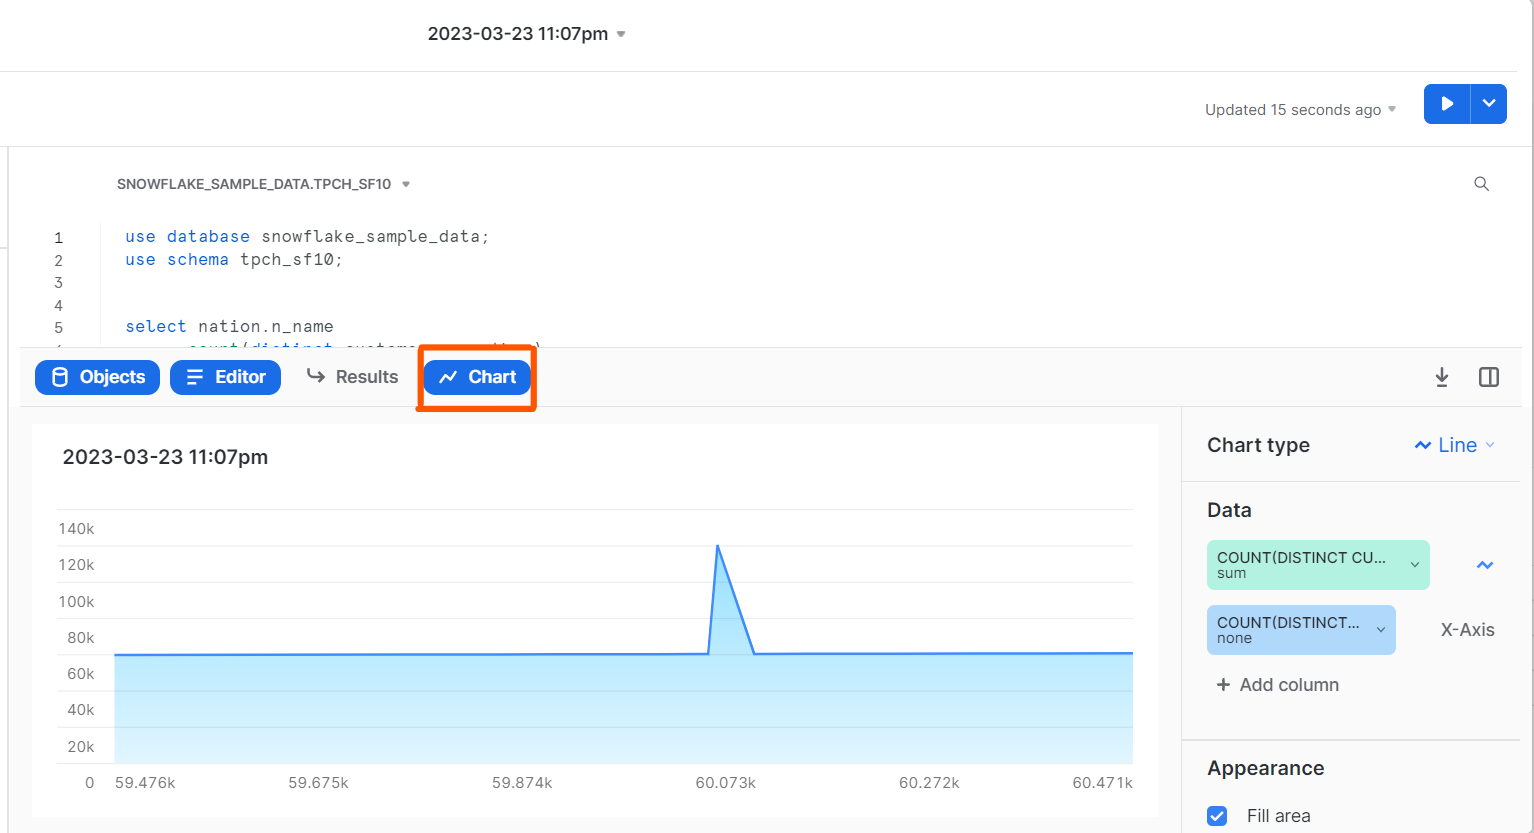
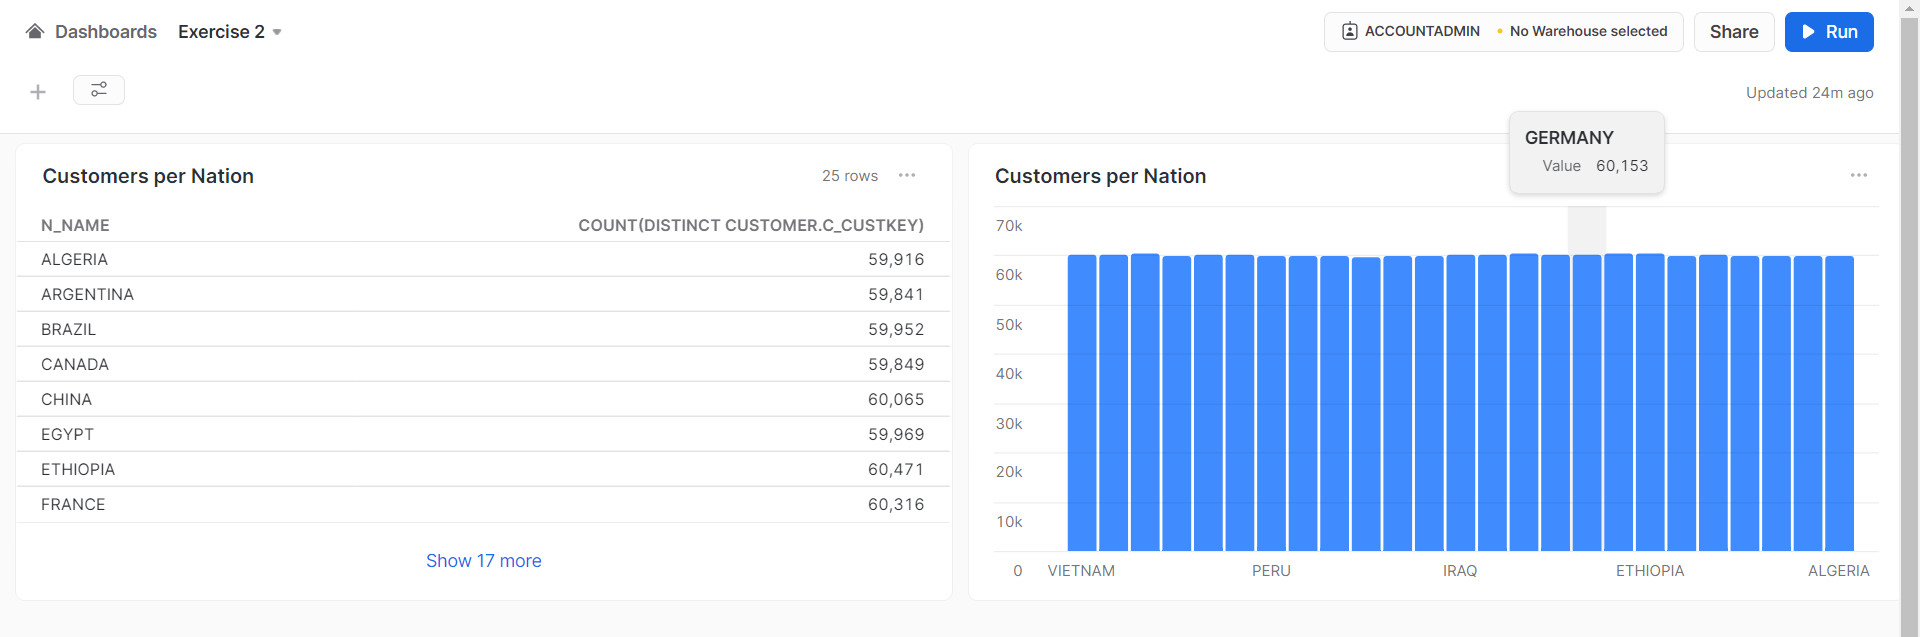
after this point pressing ‘return to exercise 2’ you will return to your Dashboard. There you will see two trims, one for the result of the query and the other one is for the chart visualization.
6) You can drag and drop the trim in any position you want; for now you will have in different rows but let’s take the chart to the right side of the result.
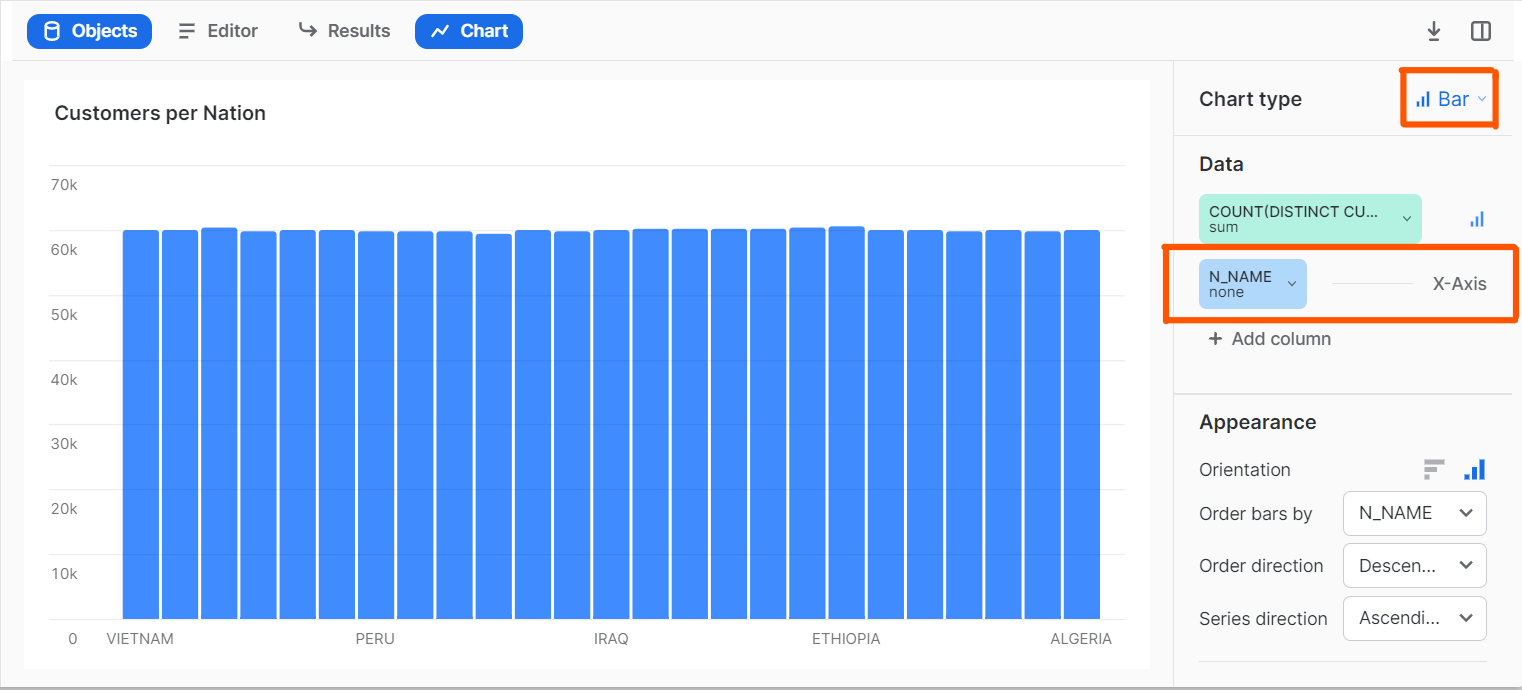
Afterthat let’s modify our chart (by pressing ‘VIEW CHART’).
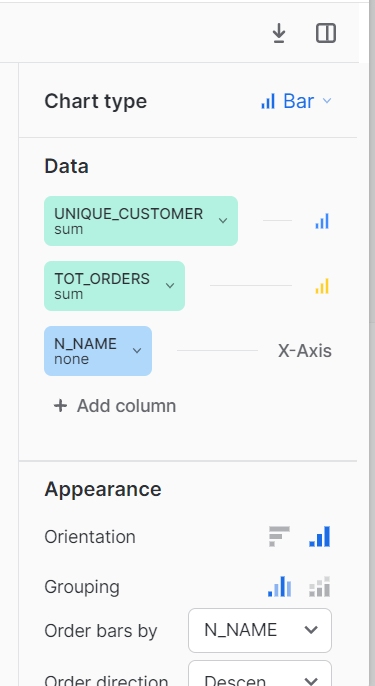
Let’s make every nations in X-AXIS and the total number of customers in bar
Multiple Query Visualization on Same Dashboard
Let’s create one new query(in new tile) and a chart of that:
We will right a query to have total orders and customers for each nation; to do so you can run this code:
SELECT nation.n_name
    , COUNT(DISTINCT customer.c_name) as unique_customer
    , COUNT(orders.o_orderkey) as tot_orders
FROM orders
INNER JOIN customer
ON orders.o_custkey = customer.c_custkey
INNER JOIN nation
ON nation.n_nationkey = customer.c_nationkey
GROUP BY nation.n_name;
so our dashboard will be:
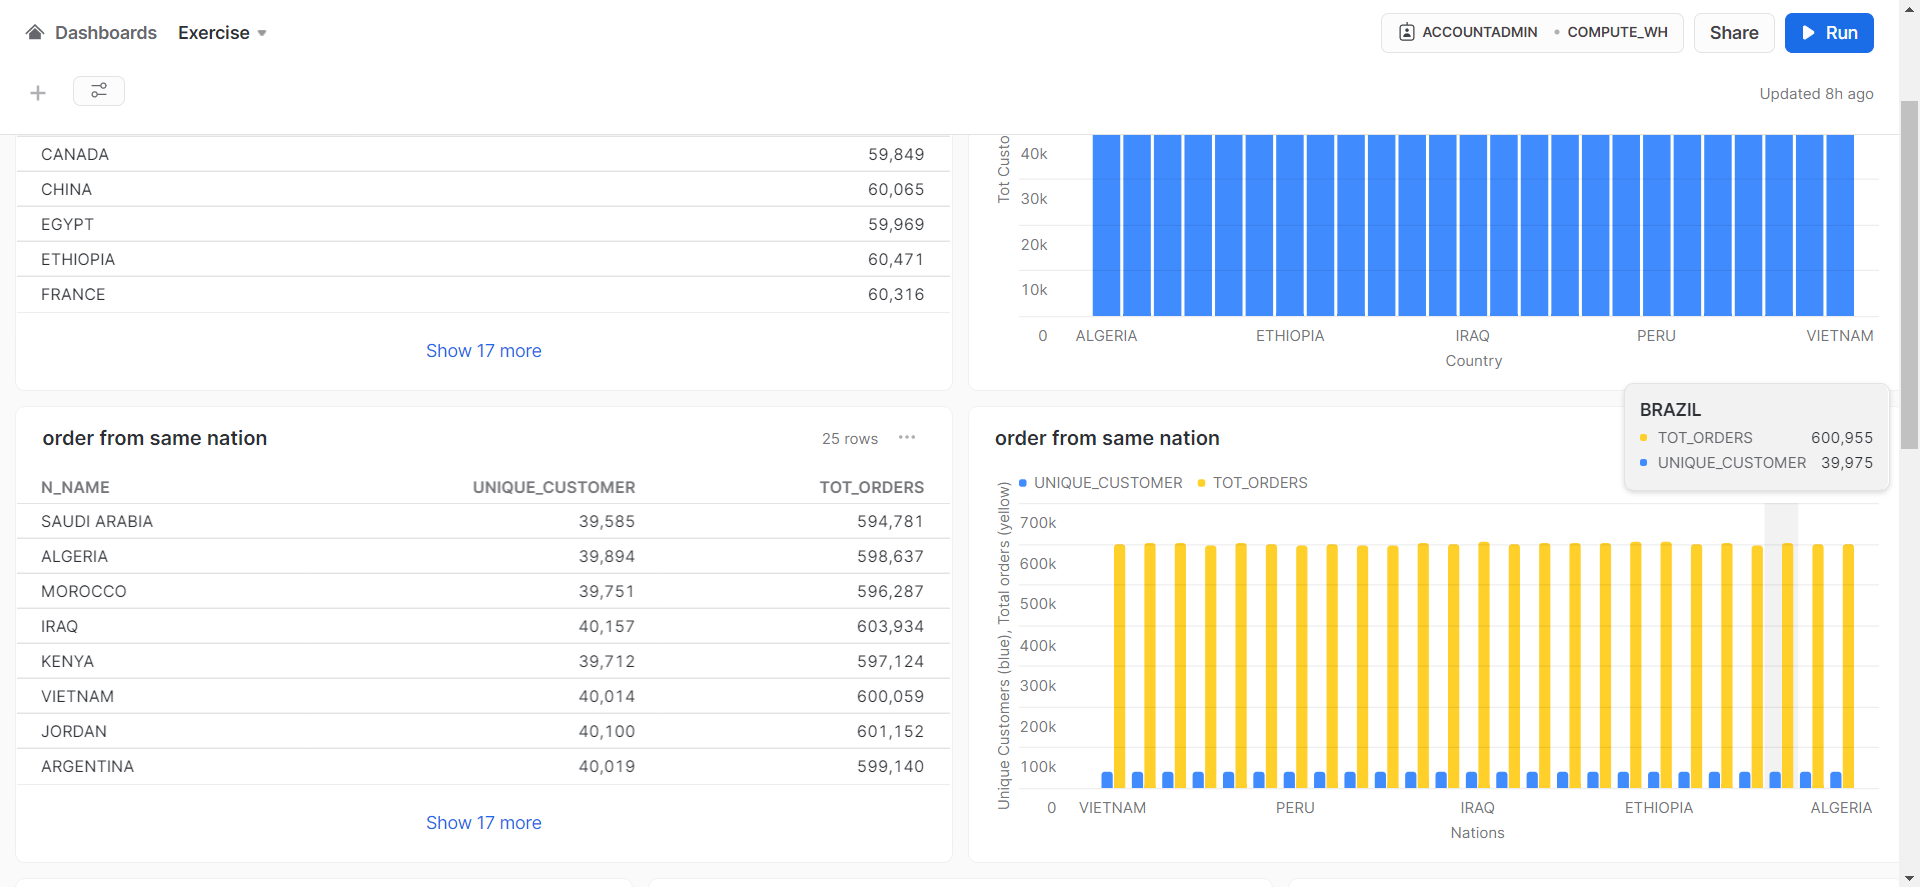
Last Example (chart without result tile (unplace a tile))
Let’s add 3 more tiles to our dashboard. Two of them will be chart visualizations and one of them will be a query result.
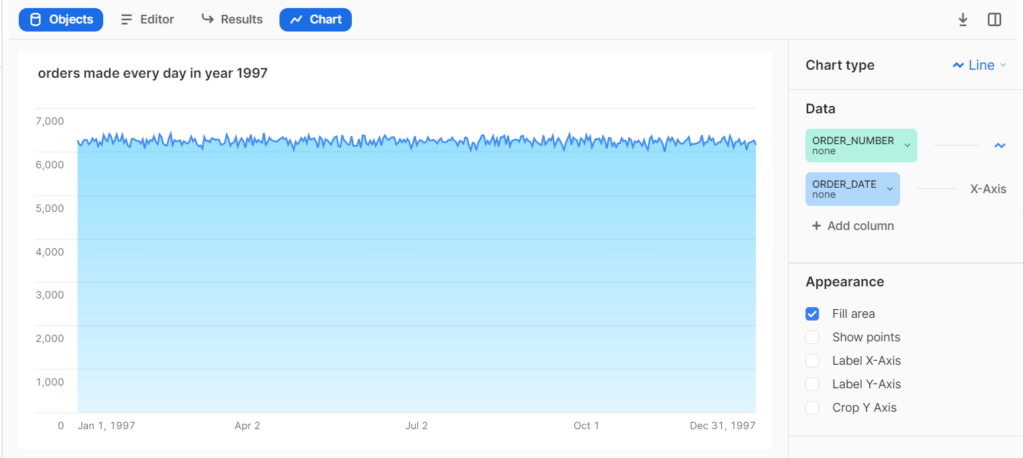
Let’s start by finding orders made everyday by customers in 1997; to do so you can run this code:
SELECT COUNT(orders.o_orderkey) AS Order_Number
    , ORDERS.o_orderdate as Order_Date
FROM orders
WHERE 1=1
    AND ORDERS.o_orderdate BETWEEN '1997-01-01' AND '1997-12-31'
GROUP BY ORDERS.o_orderdate;
this result tile will remain and we will ad a chart for it,
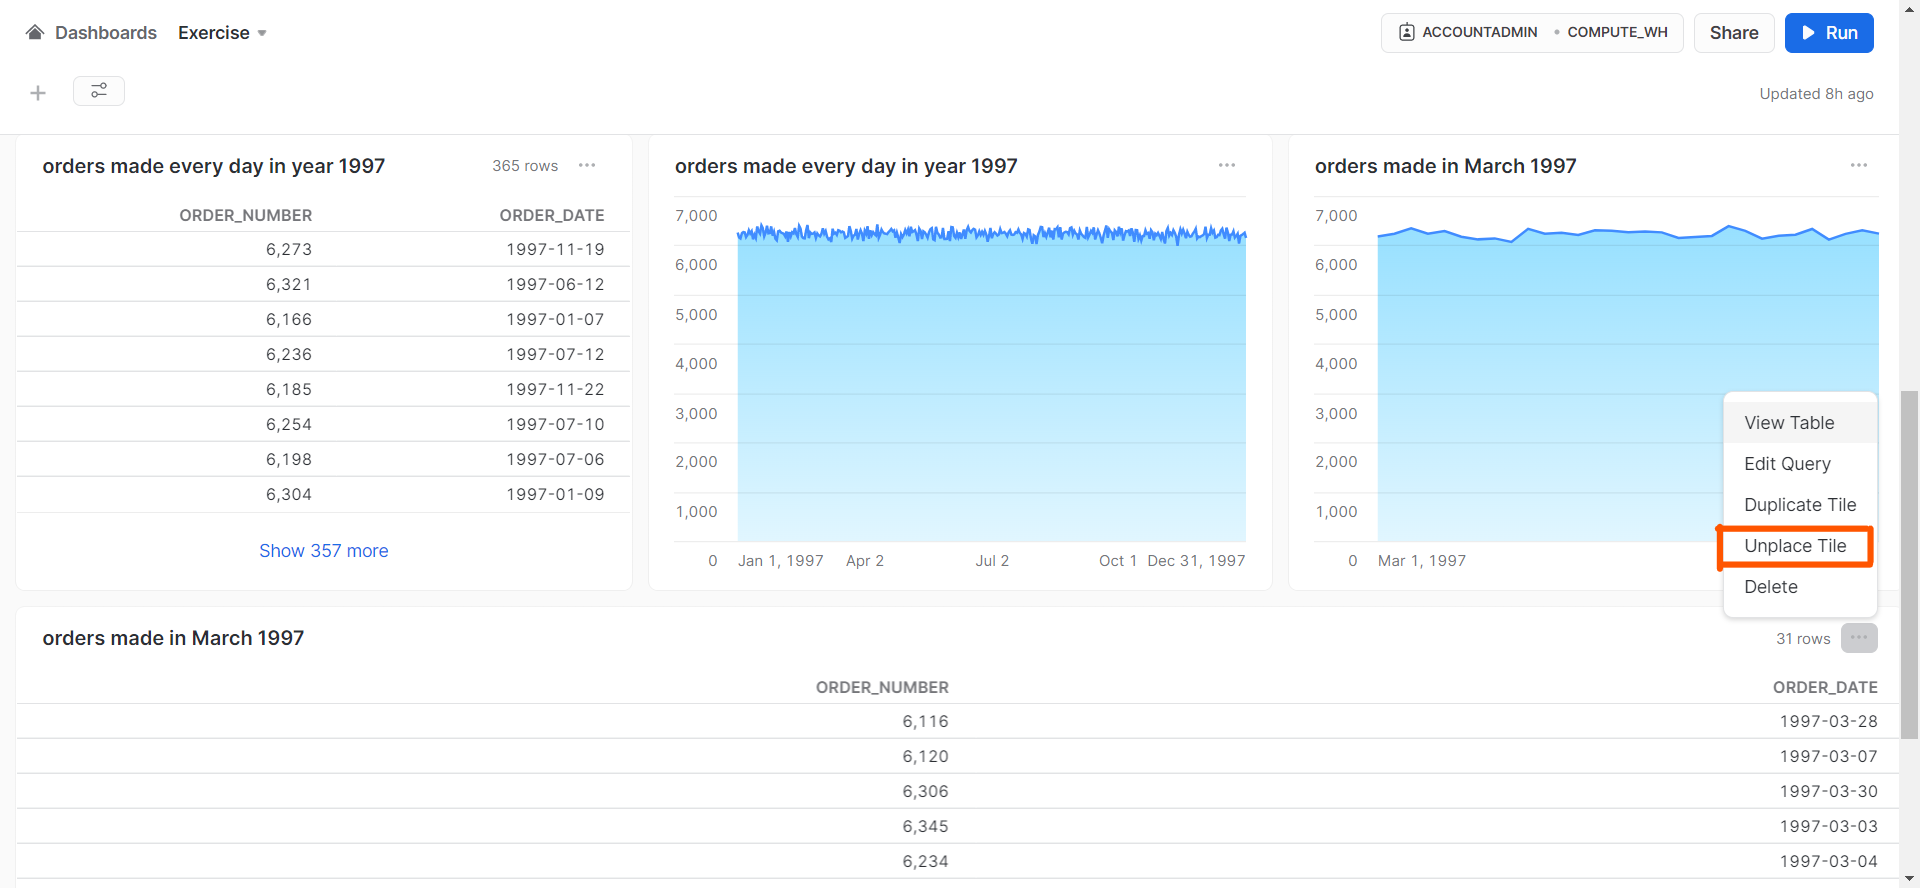
Let’s add only chart visuaization for a new query that shows us orders made in March 1997. The result will displayed automatically in dashboard but we can press ‘UNPLACE TILE’ to eliminate that part, so we can have three different tiles in a row and two of them will be charts.
Conclusion
Dashboards in Snowflake are very simple and more organized visualization way for our worksheets so for our queries. As an additional information you can create tiles and dashboads from your existing worksheets too but don’t forget that once you change their position in to dashboard there will be moved out from your ‘worksheet’ tab. After all of our changes we will have Exercise Dashboard as this:
I hope this blog helped you about your questions on Snowflake Dashboards, thank you for reading.