In the last post we looked at some useful methods for getting an overview of our data. By the end of the post, we found that some of our columns where categorical. In this post, we will pick up where we left off and learn how to handle categorical data. Once again, you can follow along using this notebook. Let’s get started.
Gender Survival Rate
Let’s start by exploring whether the gender of a passenger had any effects on their survival rate. Our intuitions about history will most likely say yes. Lets see whether the numbers agree. To do so, we will use boolean indexing, a topic about which my colleague Edoardo wrote a wonderful article that you can find here. To do so, we will filter the rows based on whether the passenger was male or female. Then we will count the number of women that survived. Finally, in order to get a percentage, we will divide by the total number of passengers. Here is how to do it on pandas:
IN: women = df.loc[df['Sex'] == 'female']['Survived']

rate_of_survival = round(sum(women)/len(women) * 100, 2)

print(f'Percentage of women who survived: {rate_of_survival}%')

OUT: Percentage of women who survived: 74.2%
Now lets do the same operation with men to see the difference:
IN: men = df.loc[df['Sex'] == 'male']['Survived']

rate_of_survival = round(sum(men)/len(men) * 100, 2)

print(f'Percentage of men who survived: {rate_of_survival}%')

OUT: Percentage of men who survived: 18.89%
Our intuition was right: gender is a good predictor of whether a passenger survived.
Class survival rate: value counts
Something else that might be a good predictor of survival is the class the passenger belonged to. As mentioned in the previous post, we can find this information in the ‘Pclass’ column. To make this calculation a bit quicker, we can use the .value_counts() method. When applied to a series, it returns another series with the number of instances of each category. In our case, the number of passengers that belong to each class.
IN: class_count=df['Pclass'].value_counts().sort_index()
class_count
OUT:
Pclass
1    216
2    184
3    491
Name: count, dtype: int64
This series shows that there were many more passengers in third class than in second and third. This will be important information to keep in mind for interpreting later results.
class survival rate: survival count
Now lets see how many of each class survived. To calculate that, we will once again recur to boolean indexing to filter our data:
IN:
first_class_survived = df.loc[df['Pclass'] == 1]['Survived'].sum()

second_class_survived = df.loc[df['Pclass'] == 2]['Survived'].sum()

third_class_survived = df.loc[df['Pclass'] == 3]['Survived'].sum()

class_survived_count=pd.Series(
    data=[first_class_survived, second_class_survived, third_class_survived],
    index=[1,2,3]
)

class_survived_count

OUT:
1    136
2     87
3    119
dtype: int64
In this series the values correspond to how many passengers from each class survived. They are relatively similar, which may lead us to conclude that class is not a good predictor of survival. But in the previous section we found out that there are many more passengers in third class than in second or third. This helps us put the data in perspective.
class survival rate: percentage
Let’s calculate the rate of survival of each class to make the data fully interpretable:
IN:
percentage_of_class=round((class_survived_count/class_count) * 100, 2)
percentage_of_class
OUT:
1    62.96
2    47.28
3    24.24
dtype: float64
Now we have a true idea of how strong a predictor of survival a passenger’s class was. While more than half of the passengers in first class survived, less than a quarter of those in third did. If we put our results into a data frame, we will be able to better appreciate this insight:
IN:
frame = {
    'Total':class_count,
    'Survived':class_survived_count,
    'Percentage':percentage_of_class
    }

pd.DataFrame(frame, index=[1,2,3])
OUT: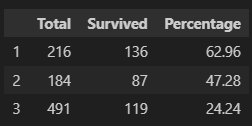
Conclusion
In this post we have seen how to numerically analyze categorical data. In part three, I intend to show you how to turn numerical data into categorical data and why you might want to do that. Stay tuned!