If you have been in the data environment for some time you will have probably heard dozens of different metrics that can be used to extract information from data. In this post I will focus on Moving Averages, and I will provide an example on how to calculate them by yourself in Python.
Situation
When you are working with real world data you could be seing something like this.
As you can see, it seems that the y value has a rather chaotic and fast (with lots of spikes) behaviour, which may have too much detail if we just want to focus on a more general overview of the behaviour.
Here is where the moving average may come in handy.
Moving Average
Given a series of values y_1, y_2, y_3, ..., y_n we define the k=2 moving average at point i as
MA_2(i) = (y_{i-2} + y_{i-1} + y_i + y_{i+1} + y_{i+2}) / (2 * k + 1)
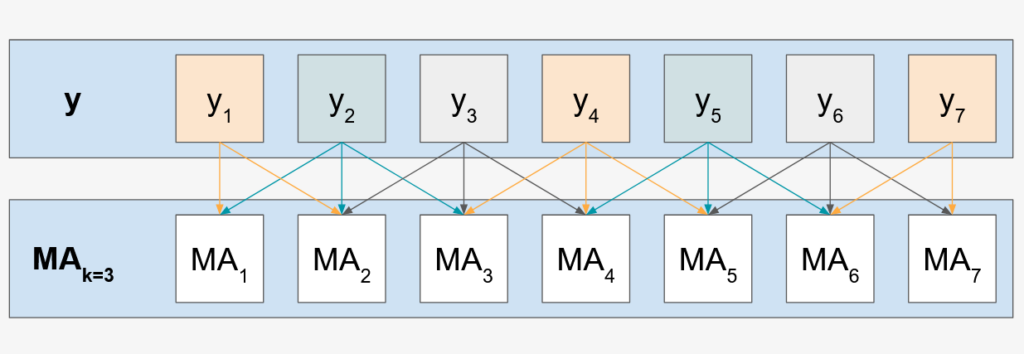
k=1Pretty easy, right? Basically, at each point i, we use that value the k values on the left and the right to calculate the average. This makes it so that changes on the values of the data affect slower the value that we are getting. In essence, it smoothes out our data.
You will notice in the previous figure that edge calculations use two values from the y function instead of three. That is something that we have to take into account on the Python calculation.
Challenge: Calculating it in Python
Now that you know what to do, go on and try to do it yourself! It is not that hard and it is a nice Python exercise for beginners. You can get the data from the following block.
np.random.seed(13)

x = np.linspace(0, 10, 1000)
y = []
y_0 = 0
for i in range(1000):
    y.append(y_0)
    y_0 = y_0 + np.random.rand() - 0.5
y = np.array(y)

df = pd.DataFrame({
    'x': x,
    'y': y
})
We have to take into account that edge values will use less data for the calculations, so the denominator will be different than in the equation that I showed above.
To fix it, I padded the y functions with zeros at the beginning and end depending on the k value used. Moreover, I created another array called indices that contain zeros for padded values and ones for normal values. This indices values will be used in the mean calculation and will provide the correct number in the denominator.
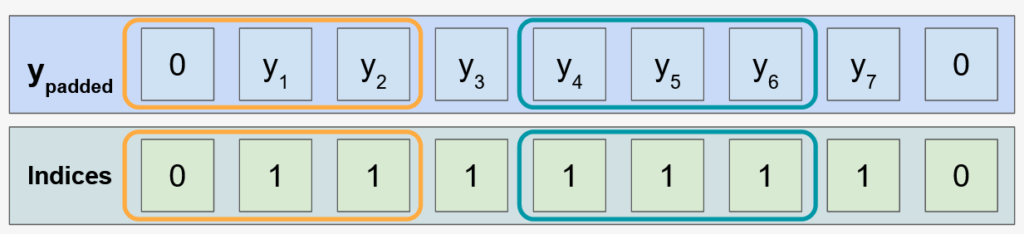
k=3As you can see, having the sum of y_padded in the numerator and the sum of indices in the denominator we will get the correct calculation of the mean for each value.
The functions to get the moving averages are very simple
def get_indices(x, k):
    return np.array([0] * k + [1] * len(x) + [0] * k)

def get_moving_average(y, k=3):
    indices = get_indices(y, k)
    pad_y = np.concatenate(([0] * k, y, [0] * k))
    return [np.sum(pad_y[i:i+2*k+1]) / np.sum(indices[i:i+2*k+1]) for i, _ in enumerate(y)]

# Calculate moving averages with several k values
ks = (3, 5, 10, 20, 50, 100, 200)

for k in ks:
    df[f'k={k}'] = get_moving_average(y, k)
Here you can see a visualization of the moving averages for the different values of k.
There are, of course, other ways of calculating the moving average, for instance, if you feel like the moving averages calculated like this are slow reacting and lag with respect to the original function, maybe take a look into exponential moving averages.
If you liked this blog and you would like to look at other blogs, I have interesting stuff in SQL and Python!