
To begin with, what is data normalization? Simply put, it’s the method of dividing larger tables into smaller, more organized ones, and then establishing connections between them. Normalized tables serve as the foundational source of truth, acting as the cornerstone for the rest of the company’s analytical endeavors.
Normalization might appear complex at first glance, but for those involved with databases, grasping it is essential. The primary goal is ensuring the efficient organization of data.
During my Analytics Engineer Traineeship at Nimbus Intelligence Academy, I tackled this challenge. I transformed a single, daunting 94-column table into 14 streamlined, easily manageable tables.
In this post, I’ll offer a distilled version of the assignment for clarity and educational value. Detailing the entire process would be quite extensive, and I aim to keep the content engaging for readers.
A step-by-step guide to normalization
Normalization in database design is a structured progression through several normal forms. As you progress from one normal form to the next, the database design becomes more robust, reducing data redundancy and improving data integrity. To know more about databases, read our blog post on non-relational databases.
Our 0NF (non-normalized) table
Let’s start from a table that’s not normalized:
burger_bliss

The Burger Bliss Table displays order numbers, order dates, customer names, their addresses, ZIP codes, burger identification codes, burger names, quantities, unit prices, and total order prices.
In the given table, we see data about orders, but the structure allows for multiple rows per order, especially if a customer orders more than one type of burger. There’s redundant data like repeating the customer’s name, address, and other details for every burger they ordered.
A normalized approach would involve splitting this table into separate tables for customers, orders, and burger items, and then using relations to connect them. This structure would reduce redundancy, ensure data integrity, and optimize storage.
First Normal Form (1NF)
At this level, the objective is to simplify the structure by eliminating duplicate columns and ensuring that each column contains the most basic unit of information.
The first normalization step involves removing any duplicate columns from the same table and separating data into multiple related tables. Each column should contain atomic (indivisible) values, and each record needs to be unique.
In our case, we’ll split the initial Burger Bliss Table into two smaller tables:
Orders

As you can see, we split the Customer Name into First Name and Last Name. The City has been separated from the address.
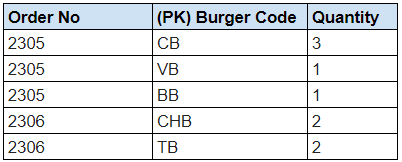
Order Details

BURGERs

Second Normal Form (2NF)
In 2NF, all non-key columns should be fully functionally dependent on the primary key. In this stage, we’re removing subsets of data into separate tables: Order Details (unchanged), Orders, Customers, and Burgers.
This leaves us with four tables:
Order details
(No changes from 1NF)
orders

customers

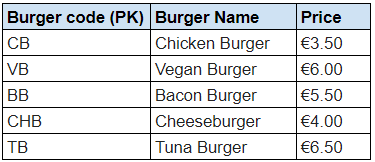
burgers
Third Normal Form (3NF)
3NF requires that every non-key attribute be functionally dependent only on the primary key. It eliminates transitive dependencies of non-key attributes on the primary key.
Upon inspecting our tables, let’s say we notice that the Price of burgers changes based on the city due to tax rates or regional pricing strategies. This means the price of a burger isn’t just dependent on the Burger code, but also on the City where it’s sold.
To move to 3NF, we’d need to address this transitive dependency. The two new tables will therefore be:
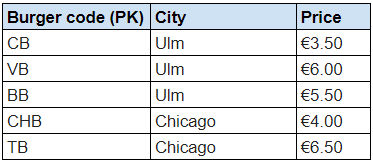
BURGER PRICES
BURGERS
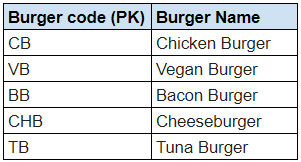
Now, the Price attribute in the Burger Prices table is directly dependent on both Burger code and City, ensuring that our database design adheres to 3NF.
Advantages and disadvantages of data normalization
Advantages:
- Reduced data redundancy & improved data integrity: The model ensures minimal repetition and maintains data quality.
- Combatting data anomalies: A structured approach that diminishes issues caused by data inconsistencies.
- Compact size: Due to the removal of data duplication, these databases are inherently more concise.
- Maintenance and understanding: Not only are these databases simpler to maintain, but they are also conceptually more straightforward to grasp.
Disadvantages:
- Performance and speed challenges: There’s a potential dip in performance due to the necessity of multiple joins between tables. The need to pull data from various tables can lead to lags. Denormalization helps with this disadvantage.
- Not analytical-query friendly: The model’s structure can be intricate, making it unsuitable for some analytical tasks.
- Complex structure: While normalization can make things conceptually easier, the actual database structure can become quite convoluted.
It’s pivotal to assess these pros and cons, aligning them with your database needs to harness the best of what normalization offers.
You normalized your data. Now what?
Now it’s time to de-normalize it! Data denormalization is the process of introducing redundancy within a database by integrating data from related tables into a single table. This is done to improve read performance, reduce the need for complex joins, and cater to specific query patterns. Read our blog post on data denormalization to know more.