This brief introduction will guide you through the very first steps of using pandas for EDA (Exploratory Data Analysis). This post will cover some useful functions for getting an overview of your data. I plan on following up this post with another one, which will explore how to analyze categorical data numerically. So stay tuned!
I will be using the ubiquitous ‘Titanic’ dataset, which is perfect for the kind of gentle introduction I aim for. If you’d like to follow along, you can download it here. In any case, I would recommend looking at its documentation before reading this post. Moreover, if you’d rather execute cells than writing code, no judgement: here you can find the notebook I created for this post.
Let’s get started.
Preliminaries
The very first thing we must do to use pandas is import it (duh!). But we don’t import it at the top just because we have to. It is generally considered a good practice to keep all your imports at the top of your notebook. This gives readers an overview of all the libraries that the notebook needs to use in order to run.
import pandas as pdThe second thing we must do is load the data. How to do so will depend on whether you are following along locally or on a remote platform. The procedure to load data remotely depends on the platform you are using. If you want to follow along locally, simply download the dataset, put it wherever you want, copy its path and substitute it below. The pandas method ‘read_csv’ will convert the csv file into a pandas data frame.
path = "your_csv_file_path"
df = pd.read_csv(path)
Now that you have a pandas data frame, you are ready to begin exploring.
Shape, head and tail
So now you have a data frame. Congrats! But how much data do you actually have? We can find out using the .shape() method:
In: df.shape
Out: (891, 12)
We can see that our titanic data frame has 890 rows and 12 columns. Now we probably want to get a general idea of what is in there before we get into the nitty-gritty of the data. Thankfully, pandas has two methods that will give us a sneak peek of the contents of our data frame. The .head() method displays the first five rows of the data frame, whereas the .tail() method displays the last five:
In: df.head()
Out:
In: df.tail()
Out:
This is a useful way to get familiarized with our data without becoming overwhelmed. We can begin to see the columns, the content of the rows, as well as any patterns between beginning and end.
Info and describe
Now we should get an idea of what we can or cannot potentially do with our data. To that end, we must find out the data type of each column and whether it has any null values. For that, we can use the .info() method:
In: df.info()
Out:
<class 'pandas.core.frame.DataFrame'>
RangeIndex: 891 entries, 0 to 890
Data columns (total 12 columns):
 #   Column       Non-Null Count  Dtype
---  ------       --------------  -----
 0   PassengerId  891 non-null    int64
 1   Survived     891 non-null    int64
 2   Pclass       891 non-null    int64
 3   Name         891 non-null    object
 4   Sex          891 non-null    object
 5   Age          714 non-null    float64
 6   SibSp        891 non-null    int64
 7   Parch        891 non-null    int64
 8   Ticket       891 non-null    object
 9   Fare         891 non-null    float64
 10  Cabin        204 non-null    object
 11  Embarked     889 non-null    object
dtypes: float64(2), int64(5), object(5)
memory usage: 83.7+ KB
As we can see, this method creates and displays a data frame of its own with the desired information. At the end of this data frame we can see that there are seven numerical values, five of them integers and two of them floats. We can find out more about them wising the method .describe():
In: df.describe()
Out: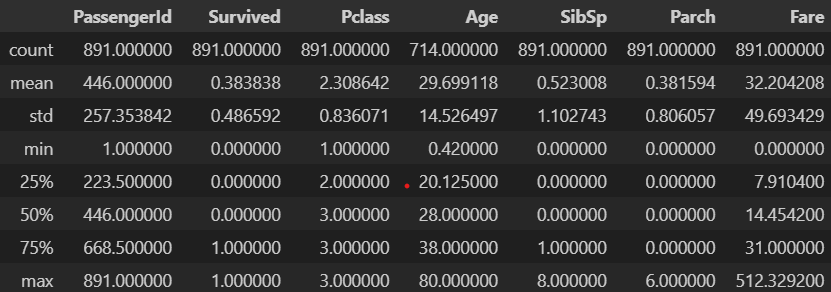
As we can see, this method creates a data frame with some useful metrics about all our numerical columns, such as the mean, the standard deviation, the percentiles and the minimum and maximum values. From it we can tell, for instance, that the the mean age is about 30, or that the maximum amount of siblings a passenger had is 8.
But some of the information that this data frame provides is not so easy to interpret. For example, the ‘PassengerId’ column is just a unique identifier for each row, so its metrics will not prove very useful. The ‘Survived’ and ‘Pclass’ columns are more interesting: their data types are numerical but the information they offer is in fact categorical. This serves as a reminder to always read the documentation and never lose sight of what the data actually means while carrying out your EDA.
nUNIQUE AND UNIQUE
If we had used the method .nunique(), we would have caught this pretty quickly:
In: df.nunique()
Out:
PassengerId    891
Survived         2
Pclass           3
Name           891
Sex              2
Age             88
SibSp            7
Parch            7
Ticket         681
Fare           248
Cabin          147
Embarked         3
dtype: int64
As we can see, .nunique() prints out the number of unique values each column has. There are two distinct values in ‘Survived’ and three for ‘Pclass’. This is a good indication that they are categorical, independently of their data types. It would be nice to know which are those unique values. For that, we can apply the method .unique() on a single column:
In: df['Survived'].unique()
Out: array([0, 1], dtype=int64)

In: df['Pclass'].unique()
Out: array([3, 1, 2], dtype=int64)
There are two values for ‘Survived’: 1, which corresponds to ‘yes’, and 0, which corresponds to ‘no’. In the case of ‘Pclass’, 1, 2 and 3 correspond to first, second and third class.
Conclusion
In part one, we have looked at the some of the most useful panda methods for getting an overview of your data. By the end of it, we have learned some important lessons about reading documentation and mistrusting data types. In the next part, you will get some tips on how to handle the categorical data we have identified at the end of this post, so stay tuned!