Today I bring you a challenge! Just a fun little exercise to train your SQL skills. We are going to try to make derivatives in SQL.
The Challenge
Let’s say that you are working in a company and you are given a time series with two columns, the day and the revenue per day. Then, your boss comes in and says that they actually want to analyze the growth of the revenue at every day. After a bit of thinking, you get the best idea: use derivatives!
In our case you can copy and paste the following to get some mock data, though you can youse any x and f(x) that you want. Make sure you edit the CREATE statements to fit the flavour of SQL that you are using. In my case, I am running this in Snowflake.
CREATE DATABASE math;

CREATE TABLE funcs(
    x float,
    y float
);

INSERT INTO math.public.funcs VALUES
(0.0, 1.0),
(0.016722408026755852, 1.0016736006126223),
(0.033444816053511704, 1.003349452945014),
(0.05016722408026755, 1.00502614428687),
(0.06688963210702341, 1.0067013077936056),
...
-- You can get the full statement in the file below
...
(4.949832775919732, 1.3237100235281762),
(4.966555183946488, 1.4679523308472862),
(4.983277591973244, 1.5726046898410695),
(5.0, 1.6342171594970862);
Reminder: What is a derivative?
For those that finished school some time ago, you can get a refresher on what a derivative is in this incredible series on introductory calculus by 3blue1brown.
For those more pragmatic that just whant to be able to do the challenge, here are the formulas that we are most interested in.


That’s it. You should now be able to provide a view that produces the columns x, y (same as f(x)) and the forward, backward and central derivatives.
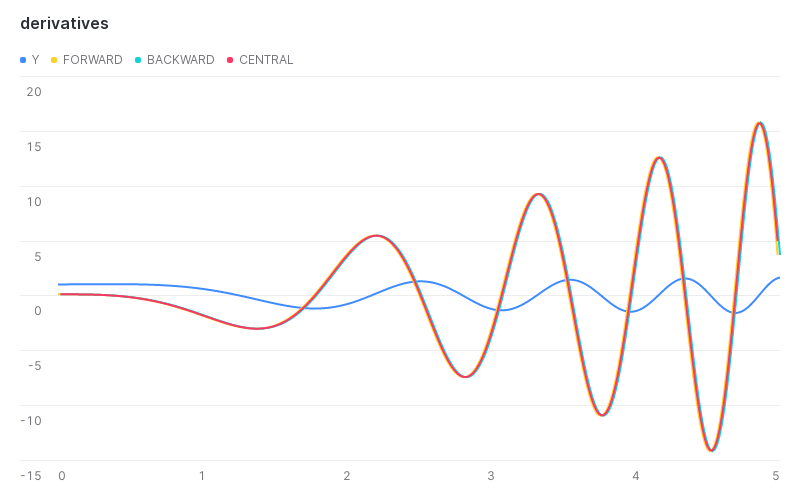
What you should get
You should get a view that when queried produced the following table
| x | y | forward | backward | central |
|---|---|---|---|---|
| 0 | 1 | 0.1000813166 | null |
null |
| 0.01672240803 | 1.001673601 | 0.1002159695 | 0.1000813166 | 0.1001486431 |
| 0.03344481605 | 1.003349453 | 0.1002661422 | 0.1002159695 | 0.1002410559 |
| 0.05016722408 | 1.005026144 | 0.1001747777 | 0.1002661422 | 0.10022046 |
| … | … | … | … | … |
| … | … | … | … | … |
| 4.949832776 | 1.323710024 | 8.625689978 | 10.726004839 | 9.675847408 |
| 4.966555184 | 1.467952331 | 6.258211068 | 8.625689978 | 7.441950523 |
| 4.983277592 | 1.57260469 | 3.684425685 | 6.258211068 | 4.971318377 |
| 5 | 1.634217159 | null |
3.684425685 | null |
Solution
Well, if you look at the formulas that we have to use, you will notice the i, i+1 and i-1 subindices on the values. Of course, this is the perfect scenario for the LAG and LEAD function.
In fact, this is the only thing that we have to think about. The rest are just simple subtraction and division operations. Below you can see my solution with the full code to get the derivatives in SQL.
CREATE OR REPLACE VIEW derivatives AS
    WITH calculations AS (
        SELECT
            -- x and y values
            x,
            y,
            -- forward calculation
            (LEAD(y, 1) OVER (ORDER BY x ASC) - y) as fdy,
            (LEAD(x, 1) OVER (ORDER BY x ASC) - x) as fdx,
            fdy / fdx as fdydx,
            -- central calculation
            (LEAD(y, 1) OVER (ORDER BY x ASC) -  LAG(y, 1) OVER (ORDER BY x ASC)) as cdy,
            (LEAD(x, 1) OVER (ORDER BY x ASC) - LAG(x, 1) OVER (ORDER BY x ASC)) as cdx,
            cdy / cdx as cdydx,
            -- backward calculation
            (y - LAG(y, 1) OVER (ORDER BY x ASC)) as bdy,
            (x - LAG(x, 1) OVER (ORDER BY x ASC)) as bdx,
            bdy / bdx as bdydx
        FROM funcs
    )
    SELECT
        x,
        y,
        fdydx AS forward,
        bdydx AS backward,
        cdydx AS central
    FROM calculations;

SELECT * FROM derivatives;
Do you have another solution? Send it over to eloi.sanchez@54.246.162.21!
Are you into Python as well? Make sure to check another interesting blog about Python’s tricky stuff. Do you tend to like more visual stuff? Well, maybe try out this one about data visualization in Streamlit!